BBALL Insights
Stats are facts. Analytics tell the story.
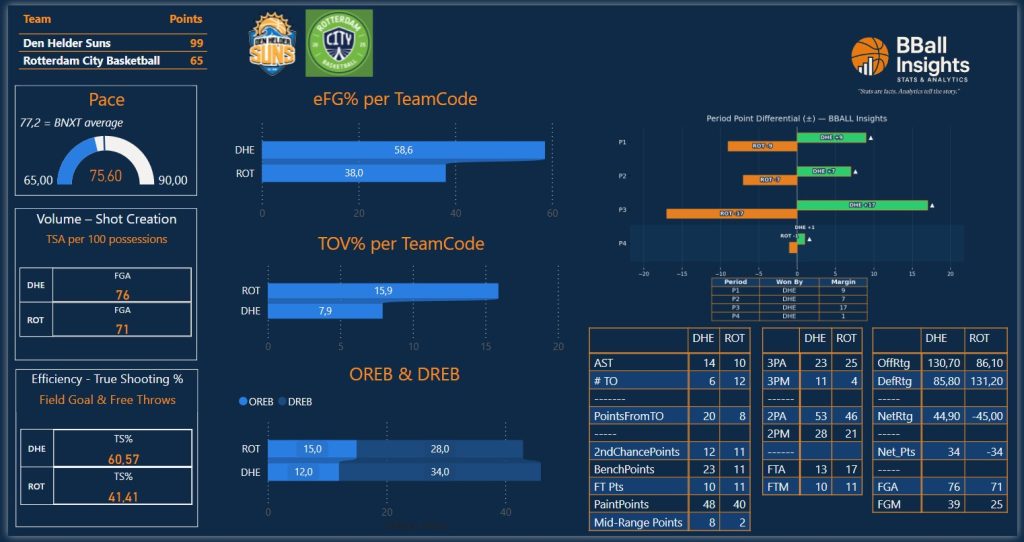
Den Helder Suns vs Rotterdam City Basketball
Game Summary
Post-game overview and game-defining swing
Game-defining swing: Turning point (Grootste swing over 2 min window): DHE zette de grootste swing neer (Q2 5:51 → Q2 4:07, Δ+10).
Score Extremes
Largest lead and deficit swings
- DHE biggest lead: 36
- DHE biggest deficit: 6
- ROT biggest lead: 6
- ROT biggest deficit: 36
Quarter Flow
Quarter edge and cumulative score
| Q | DHE | ROT | Diff (H-A) | Edge | Cum Score |
|---|---|---|---|---|---|
| Q1 | 27 | 18 | +9 | DHE | 27-18 |
| Q2 | 24 | 18 | +6 | DHE | 51-36 |
| Q3 | 26 | 8 | +18 | DHE | 77-44 |
| Q4 | 22 | 21 | +1 | DHE | 99-65 |
Team Leaders
PTS • AST • REB leaders
- Den Helder Suns: PTS R. Mesidor (32) • AST N. Thran (5) • REB J. Visser (10)
- Rotterdam City Basketball: PTS J. Graham (17) • AST C. Van La Parra (3) • REB T. Verhoeven (10)
Top Scorers
Top 3 scorers per team
- Den Helder Suns: R. Mesidor (32), B. Antoine (12), C. Gilmore (12)
- Rotterdam City Basketball: J. Graham (17), T. Verhoeven (14), J. Spence (10)
Game Visuals
Momentum, score progression and minute-bucket scoring
Scoreflow (lead + momentum)

Score progress (home vs away)

Scoring heatmap (scores per minute bucket)

Shot Mix
Points by type and shooting output
DHE — Den Helder Suns
Point share by type
ROT — Rotterdam City Basketball
Point share by type
Shot Mix = points share (2PT / 3PT / FT). Labels show made/attempts (%).
Team & Player Impact
Usage, efficiency and contribution within team context
| TeamCode | UnitType | Player | MIN | PTS (share) | AST (share) | OREB (share) | DREB (share) | TO (share) | TS% | Usage | ImpactScore | +/- |
|---|---|---|---|---|---|---|---|---|---|---|---|---|
| DHE | Starter | R. Mesidor | 28:46 | 32 (32%) | 1 (7%) | 2 (17%) | 2 (6%) | 2 (33%) | 70.7% | 27.7% | 28.7 | 20 |
| DHE | Starter | B. Antoine | 27:13 | 12 (12%) | 1 (7%) | 1 (8%) | 2 (6%) | 0 (0%) | 75.0% | 9.8% | 33.5 | 19 |
| DHE | Starter | S. Uijtendaal | 26:45 | 12 (12%) | 2 (14%) | 0 (0%) | 6 (18%) | 0 (0%) | 47.0% | 15.6% | 44.1 | 29 |
| DHE | Starter | C. Gilmore | 26:32 | 12 (12%) | 1 (7%) | 0 (0%) | 8 (24%) | 0 (0%) | 55.1% | 13.3% | 42.8 | 25 |
| DHE | Starter | D. Stover | 23:22 | 8 (8%) | 2 (14%) | 3 (25%) | 4 (12%) | 0 (0%) | 44.4% | 11.0% | 59.1 | 22 |
| DHE | Bench | N. Thran | 22:13 | 5 (5%) | 5 (36%) | 0 (0%) | 0 (0%) | 2 (33%) | 56.3% | 5.4% | 7.4 | 23 |
| DHE | Bench | J. Visser | 17:02 | 8 (8%) | 0 (0%) | 4 (33%) | 6 (18%) | 0 (0%) | 57.1% | 8.6% | 59.1 | 11 |
| DHE | Bench | N. Van Der Heiden | 13:04 | 5 (5%) | 0 (0%) | 2 (17%) | 4 (12%) | 1 (17%) | 83.3% | 3.7% | 16.8 | 10 |
| DHE | Bench | T. Beens | 10:03 | 2 (2%) | 1 (7%) | 0 (0%) | 1 (3%) | 1 (17%) | 33.3% | 3.7% | -4.6 | 11 |
| DHE | Bench | R. Balsa | 5:00 | 3 (3%) | 1 (7%) | 0 (0%) | 1 (3%) | 0 (0%) | 150.0% | 1.2% | 13.1 | 0 |
| ROT | Starter | T. Verhoeven | 29:22 | 14 (22%) | 0 (0%) | 4 (36%) | 6 (26%) | 0 (0%) | 51.3% | 17.4% | 84.0 | -26 |
| ROT | Starter | J. Graham | 29:13 | 17 (26%) | 1 (10%) | 1 (9%) | 5 (22%) | 3 (25%) | 50.4% | 21.5% | 42.0 | -19 |
| ROT | Starter | J. Spence | 24:25 | 10 (15%) | 3 (30%) | 1 (9%) | 1 (4%) | 5 (42%) | 36.3% | 17.5% | 17.2 | -17 |
| ROT | Starter | C. Nwokeji | 22:07 | 4 (6%) | 0 (0%) | 1 (9%) | 1 (4%) | 1 (8%) | 50.0% | 5.1% | 11.3 | -22 |
| ROT | Starter | T. De Vaal | 20:35 | 9 (14%) | 1 (10%) | 2 (18%) | 3 (13%) | 0 (0%) | 50.0% | 11.5% | 55.1 | -12 |
| ROT | Bench | N. Slingerland | 21:57 | 0 (0%) | 2 (20%) | 1 (9%) | 4 (17%) | 0 (0%) | 0.0% | 2.5% | 46.5 | -21 |
| ROT | Bench | N. Vrencken | 17:45 | 9 (14%) | 0 (0%) | 0 (0%) | 1 (4%) | 1 (8%) | 50.7% | 11.3% | 9.9 | -23 |
| ROT | Bench | L. Nilsen | 15:38 | 2 (3%) | 0 (0%) | 0 (0%) | 2 (9%) | 1 (8%) | 30.1% | 4.2% | 3.4 | -20 |
| ROT | Bench | C. Van La Parra | 14:01 | 0 (0%) | 3 (30%) | 1 (9%) | 0 (0%) | 1 (8%) | 0.0% | 8.9% | 30.8 | -7 |
ImpactScore combines scoring share, assist share, offensive rebound share, defensive rebound share, and turnover penalty.
Player Impact Story
Automated impact narrative by team
DHE
- J. Visser had the biggest overall impact (ImpactScore 59.1).
- R. Mesidor led the scoring load with 32 (32%) of the team's points on 70.7% TS.
- N. Thran dominated the playmaking with a game-high 5 assists (36% of team assists).
- J. Visser controlled the boards with the highest rebound share.
- J. Visser provided the strongest bench impact with an ImpactScore of 59.1 in 17:02.
ROT
- T. Verhoeven had the biggest overall impact (ImpactScore 84.0).
- J. Graham led the scoring load with 17 (26%) of the team's points on 50.4% TS.
- J. Spence dominated the playmaking with a game-high 3 assists (30% of team assists).
- T. Verhoeven controlled the boards with the highest rebound share.
- N. Slingerland provided the strongest bench impact with an ImpactScore of 46.5 in 21:57.
Advanced Team Stats
Four Factors, ratings and efficiency context

Four Factors: eFG%, ORB%, FTR higher is better; Ball Control = 1 − TOV% (higher is better). Ratings: ORtg higher is better; DRtg lower is better; NetRtg = ORtg − DRtg. Pace = possessions (context).
Volume & Efficiency Summary
| Metric | DHE | ROT | Edge |
|---|---|---|---|
| FG (made/att) | 39/76 (51%) | 25/71 (35%) | DHE +5 |
| 2PT (made/att) | 28/53 (53%) | 21/46 (46%) | DHE +7 |
| 3PT (made/att) | 11/23 (48%) | 4/25 (16%) | ROT +2 |
| FT (made/att) | 10/13 (77%) | 11/17 (65%) | ROT +4 |
| TSA (FGA+0.44*FTA) | 81.7 | 78.5 | DHE +3 |
| TS% | 60.6% | 41.4% | DHE +19.2pp |
| eFG% | 58.6% | 38.0% | DHE +20.5pp |
| TO (total) | 6 | 12 | DHE +6 |
| TO / TSA | 7.3% | 15.3% | DHE +7.9pp |
| OREB (total) | 12 | 11 | DHE +1 |
Volume = how many chances (FGA/TSA). Efficiency = how well those chances turned into points (TS%, eFG%). TO and OREB are key possession-swing levers that often decide games.
Conclusion — Why this game was won
Summary of efficiency, volume and possession swing
DHE won vooral door betere efficiency, niet door puur meer volume.
- Efficiency edge: DHE 60.6% TS vs ROT 41.4% (+19.2pp).
- Shot quality: DHE 58.6% eFG vs ROT 38.0% (+20.5pp).
- Volume: DHE 81.7 TSA vs ROT 78.5 (+3.2).
- 3PT swing: DHE 11/23 vs ROT 4/25 (made diff +7).
- Possession swings: OREB DHE 12 vs ROT 11, TO DHE 6 vs ROT 12.
The final margin of +34 points is best explained by a mix of volume (TSA), conversion quality (TS% / eFG%), and possession swings (OREB / TO).
Points Explained — Where the margin came from
Shot value and possession swings translated into points
| Points Balance | Impact (pts) |
|---|---|
| 2PT scoring | +14 |
| 3PT scoring | +21 |
| Free throws | -1 |
| OREB edge | +1.2 |
| TO edge | +6 |
| Explained total | +41.2 |
| Final margin | +34 |
- 2PT scoring impact: +14 pts
- 3PT scoring impact: +21 pts
- Free throw impact: -1 pts
- Offensive rebounds: +1 → approx +1.2 pts
- Turnover control: +6 → approx +6 pts
The biggest swing came from 3PT scoring (+21 pts), followed by 2PT scoring (+14 pts). Combined impact ≈ +41.2 points versus a final margin of +34.